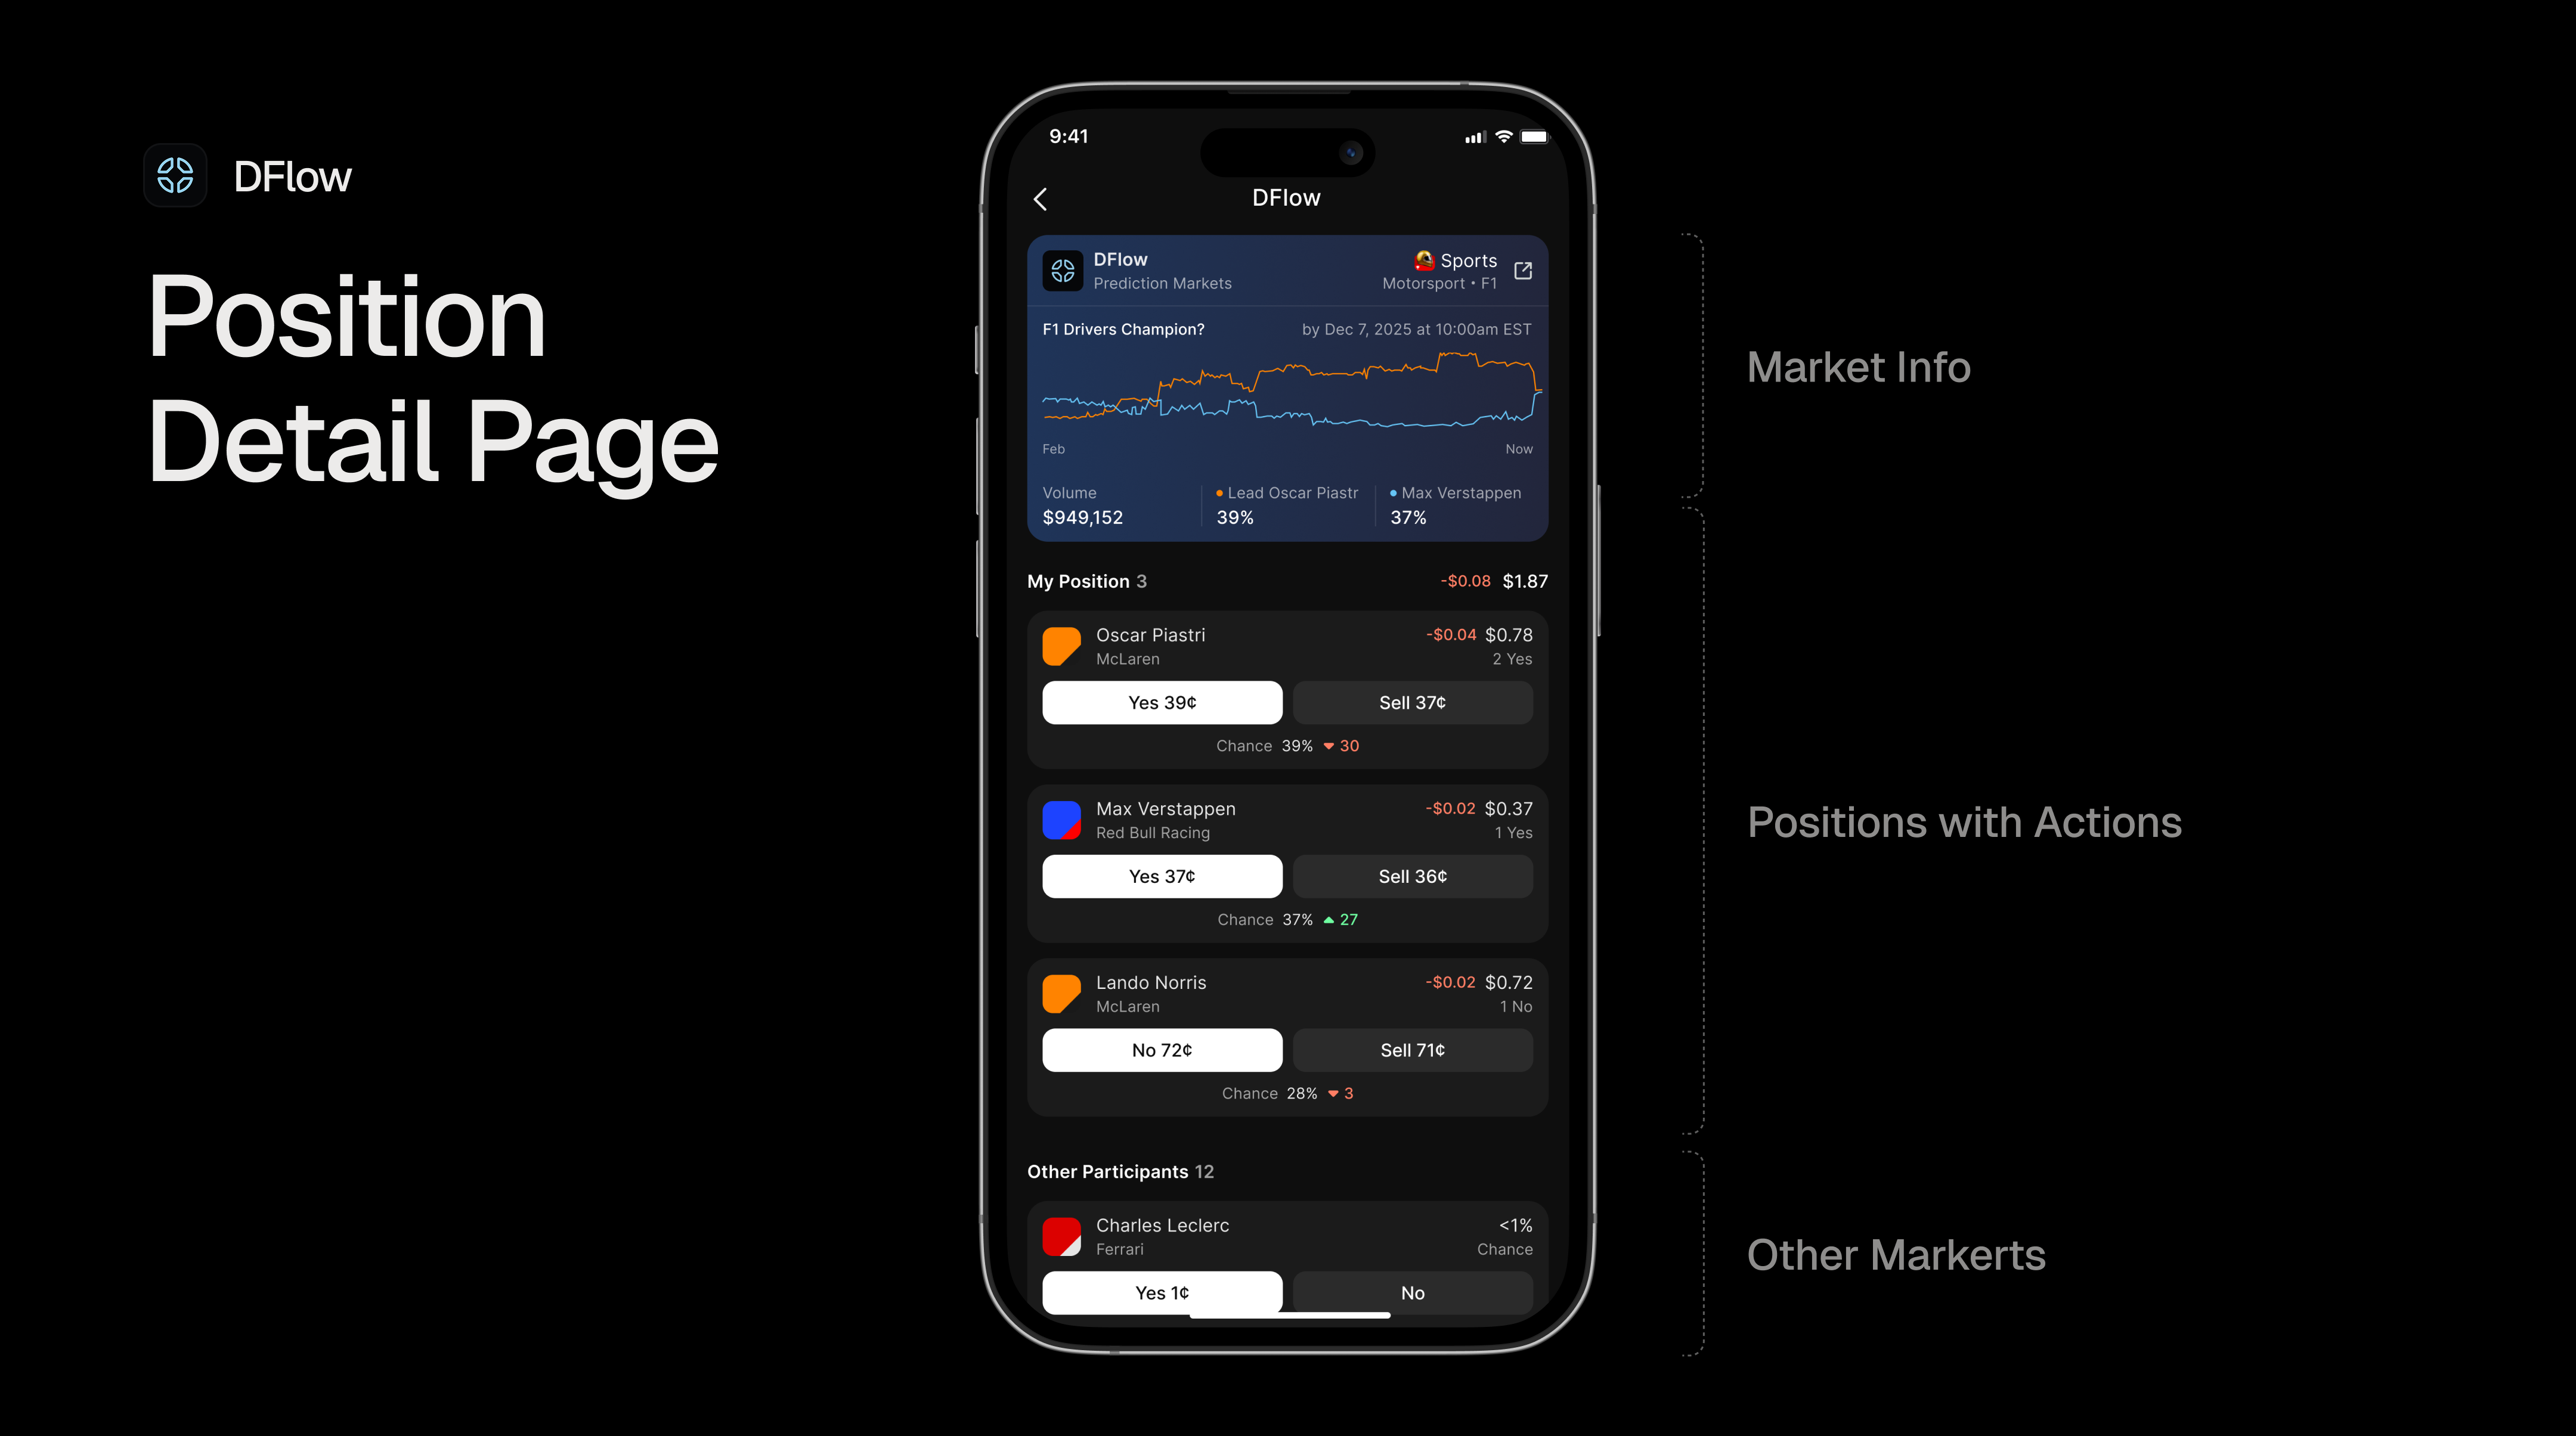
 Prediction markets allow users to bet on the outcomes of real-world events. Users can buy “Yes” or “No” outcome tokens with the price of these tokens reflecting the market’s collective belief about the likelihood of an event occurring.
Our Markets API provides all the information you need to build prediction market interfaces, including:
Prediction markets allow users to bet on the outcomes of real-world events. Users can buy “Yes” or “No” outcome tokens with the price of these tokens reflecting the market’s collective belief about the likelihood of an event occurring.
Our Markets API provides all the information you need to build prediction market interfaces, including:
- basic protocol information,
- market title and status,
- bid/ask prices for Yes and No outcomes,
- trading volume and open interest,
- outcome tokens information,
- timing information (open, close, expirationTime), etc.
Supported Protocols
Our Markets API currently supports prediction markets from DFlow, who are the official provider for Kalshi. If you want more information on the protocols that are supported or want to request more providers, please refer to the Supported Protocols Section page.Understanding Events and Markets
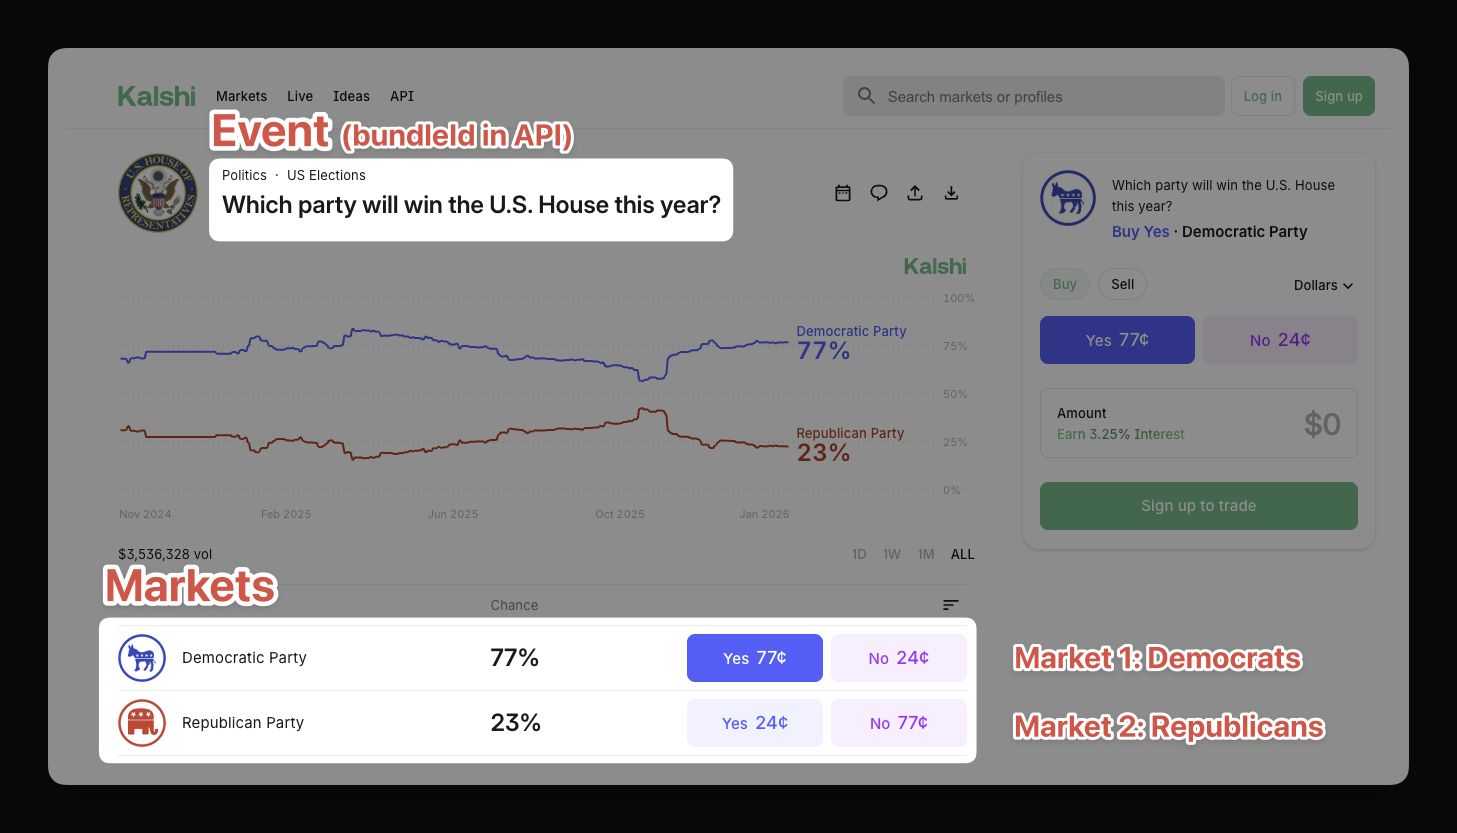 When working with prediction markets, it’s important to understand the distinction between events and markets:
- Markets are the individual tradable outcomes within an event (e.g., “Democratic Party wins - Yes/No”, “Republican Party wins - Yes/No”)
- Events are groupings of markets (e.g., “Which party will win control of the US House in 2026?”)
Markets
A single event typically has multiple markets. In our example the question “Which party will win control of the US House in 2026?” will create two markets:- Market for the Domocratic Party (Yes/No) and
- Market for the Republican Party (Yes/No).
- CASH market — For purchasing with Phantom’s stable coin
- USDC market — For purchasing with USDC
Events
ThebundleId field is the key to grouping markets that belong to the same underlying event. All markets for the same question share the same bundleId, allowing you to:
- Display related bets together in your UI
- Create “position bundles” showing all positions for a single event
- Build event-centric dashboards similar to Kalshi’s interface
Example: Grouping Political Markets
Our API will return you four markets for the “Control of the House 2026” event. In order to make it easier for your users, it is recommended to group these markets by theirbundleId. The example bleow illustrates this concept for the CASH markets:
Multiple markets with same bundleId
bundleId: "house-control-2026", indicating they belong to the same underlying event.
Grouping Markets by Event
Data Structure
Below is an example of a prediction market response from the Markets API. Based on customer demand, we may add more fields to the response in the future. For the latest data structure, please have a look at our Markets API Reference page.Please note that we do our best to design our APIs to be non-breaking. It is
recommended to filter the response and only include the fields / types you
need to ensure it won’t break your application if new fields are added over
time.
Prediction Markets Data Structure
Practical Example
In order to better understand how the API works, let’s walk through an example response for a DFlow prediction market. This example shows a political prediction market for control of the U.S. House:API Response for DFlow Prediction Market
Understanding the Response
What you can see here is the original response from the API. As mentioned in the introduction section, this response is powerful enough to drive full-fledged dashboards and applications. Let’s break it down into its components:-
Market Identity:
id: Unique identifier combining protocol, market type, and market slugtype: Market category (alwayspredictionfor prediction markets)provider: Protocol information for branding in your UItitle: The market question users are betting onsubtitle: Additional context about the market (optional)websiteUrl: Direct link to the market on the protocol’s website
-
Market Status:
status: Current state of the marketopen— Market is active and accepting tradesclosed— Trading has ended, awaiting settlementsettled— Outcome has been determined and payouts processed
result: The final outcome (only present when settled)
-
Pricing (Implied Probabilities):
yesBid(0.23) /yesAsk(0.24) — Bid/ask prices for Yes tokens, implying ~23-24% probabilitynoBid(0.76) /noAsk(0.77) — Bid/ask prices for No tokens, implying ~76-77% probability
-
Market Metrics:
volume($1.86M) — Total trading volume in USDopenInterest($1.11M) — Total value of outstanding positions
-
Timing:
openTime— When the market opened for trading (Unix timestamp)closeTime— When trading will close (Unix timestamp)expirationTime— When the market will be settled (Unix timestamp)
-
Outcome Tokens:
yesToken/noToken— Token information for each outcome, including mint addresses for on-chain interaction
-
Bundle ID:
bundleId(“dflow.prediction.CONTROLH-2026”) — Groups markets belonging to the same underlying event. All markets with the same bundleId are related (e.g., different party outcomes for the same election, or the same market with different purchase tokens).
-
Additional Data: The
additionalDataobject contains protocol-specific metadata. See Protocol-Specific Additional Data for details.
Filtering Prediction Markets
If you are only interested in specific prediction markets, you can use thefilters parameter to refine your API requests.
Filters only work for
prediction market type. Make sure to set this type
before sending your request.openclosedsettled
- Open only:
{"prediction":{"status":["open"]}} - Exclude settled:
{"prediction":{"status":["open","closed"]}}
Tracking Prediction Positions
Our Positions API and PnL API give you everything you need to track a user’s prediction market activity. Without them, tracking DFlow positions requires multiple steps:- Fetch all token accounts for a wallet
- Get tokenized account mints
- Use DFlow’s endpoint to filter outcome token mints
- Fetch market details for those mints
Fetching Positions
Our Positions API is designed to return you all positions for a given wallet address. Then you can add thetype=prediction parameter to filter the positions by market type.
Grouping Positions by Event
Use thebundleId field to group a user’s positions that belong to the same underlying event:
Grouping Positions by Event
Filtering for Active Positions
By default, the Positions API returns all positions. To get only positions in markets that are still actively trading, filter bymarket.status:
Filtering for Active Positions
market.status field indicates the current state of the market:
If you need more filtering options, please reach out to us at hello@dialect.to.
Cost Basis
The Positions API includes cost basis data for prediction market positions, giving you insight into a user’s average entry price and total capital committed to a position. It answers the question: “How much did I spend to acquire the tokens I currently hold?” Cost basis is calculated using the average cost method, which is the same approach used by traditional brokerages.Response Fields
The following fields are included on each prediction position:Example Response
Here is an example of a prediction position response that includes cost basis data:Prediction Position with Cost Basis
- The user holds 2 “Yes Akron” tokens (
amount: 2) worth $2.00 (amountUsd: 2) - Their total capital committed is $1.77 (
costBasisTotal: 1.772609) - Their average entry price is $0.89 per token (
costBasisAvg: 0.8863045) - Since the market settled as “yes” and each token pays out $1.00, this position is profitable
How Cost Basis is Calculated
Cost basis tracks two values per position: the total capital (costBasisTotal) committed and the average price per token (costBasisAvg). These values evolve with every trade event:
Note that the sell price does not affect cost basis. Sells are treated purely as inventory reductions at average cost. When quantity reaches zero (full exit), any subsequent buys are treated as a new position with no historical carryover.
Transfers
Besides trades, positions can also change through token transfers. Here is how transfers affect cost basis:
- Inbound transfers are treated as buy events at the current average cost basis. If no position exists yet (i.e., the transfer is the first event for this wallet), the current market price is used instead.
- Outbound transfers are treated as sell events, reducing both quantity and total cost basis.
Notice that after the full exit, the new buy starts fresh with no carryover from the previous trading episode.
PnL
PnL allows the user to see how their positions are performing. It answers the question: “Am I profitable or am I loosing money?” The Positions API returns PnL for active positions only. Once a user fully redeems their outcome tokens, the position is closed and no longer returned. Use the PnL API to access PnL across all positions, including closed ones.Response Fields
Each prediction position includes apnl object containing the following fields:
total and totalLifetime differ when a user has fully exited and re-entered
a position. total reflects the current open position only, while
totalLifetime carries forward gains and losses from previous closed
episodes.Example Response
Prediction Position with PnL
- The user holds 1 Yes token currently worth $1.00 (
amountUsd) - Their cost basis is $0.95 (
costBasisTotal), reflecting the buying price of the token - No shares have been sold yet, so:
realizedPnL is $0 andunrealizedPnL is +$0.05 (current value minus cost basis)totalis +$0.05
Unrealized PnL is calculated using the bid-side price of the outcome
token, which represents what a user would actually receive if they sold their
position today.
Capital
Thecapital object is available in the PnL API and nested inside the pnl object in the Positions API. It answers the question: “Have I broken even yet, and how much of my own money is still at stake?”
Unlike PnL, capital values are price-agnostic, which means they only change when a buy or sell event happens, not when the market moves. This makes the capital object a stable measure of your capital commitment to a position.
How it differs from PnL and Cost Basis
Response Fields
Example Response
Position with Capital Object (from PnL API)
Understanding netFlow
netFlow is calculated as total sells minus total buys. It tracks whether you’ve gotten your money back through sales.
netFlow is unaffected by price changes. It only moves when you execute a trade:
- Buy →
netFlowdecreases (more of your capital is committed) - Sell →
netFlowincreases (capital is returned to you)
Example
Here is a step-by-step example showing howinvested and netFlow evolve across multiple trades, assuming an initial buy of $100:
Note that
invested only increases with buys, regardless of how much was sold. It represents the cumulative capital committed to the position, not the current exposure.
Use capital.netFlow to show users how far they are from breakeven. A value of 0 means they’ve gotten their money back through sells. Anything above 0 is pure realized profit.
Protocol-Specific Additional Data
TheadditionalData field contains DFlow-specific metadata that may be useful for advanced integrations:
DFlow Additional Data
The
eventTicker in additionalData corresponds conceptually to the
bundleId field. Both can be used to identify markets that belong together.